This stream is aimed at scientists who are looking to improve and expand their data visualisation skills. This is ideal for students or researchers wanting to produce high-impact figures, people working with geospatial data, or with an interest in science communication. For this stream, we will assume you have some basic R experience and know how to import files and manipulate data to some degree. (You don’t? Try our Stats from Scratch course stream instead, or just visit some of its tutorials for a refresher.)
We will first teach you to format your datasets in the most efficient way for plotting and the basics of the ggplot2 package. Then, we’ll move way beyond basic and learn to customise all the elements of a graph, create our own palettes and themes, and use panels to declutter graphs. We will use different types of data, from model predictions to geographical data, and work towards presenting them in an engaging and informative way. Finally, we’ll explore the Markdown language for professional and reproducible reporting of codes and results, and have fun with interactive web apps!
Getting started
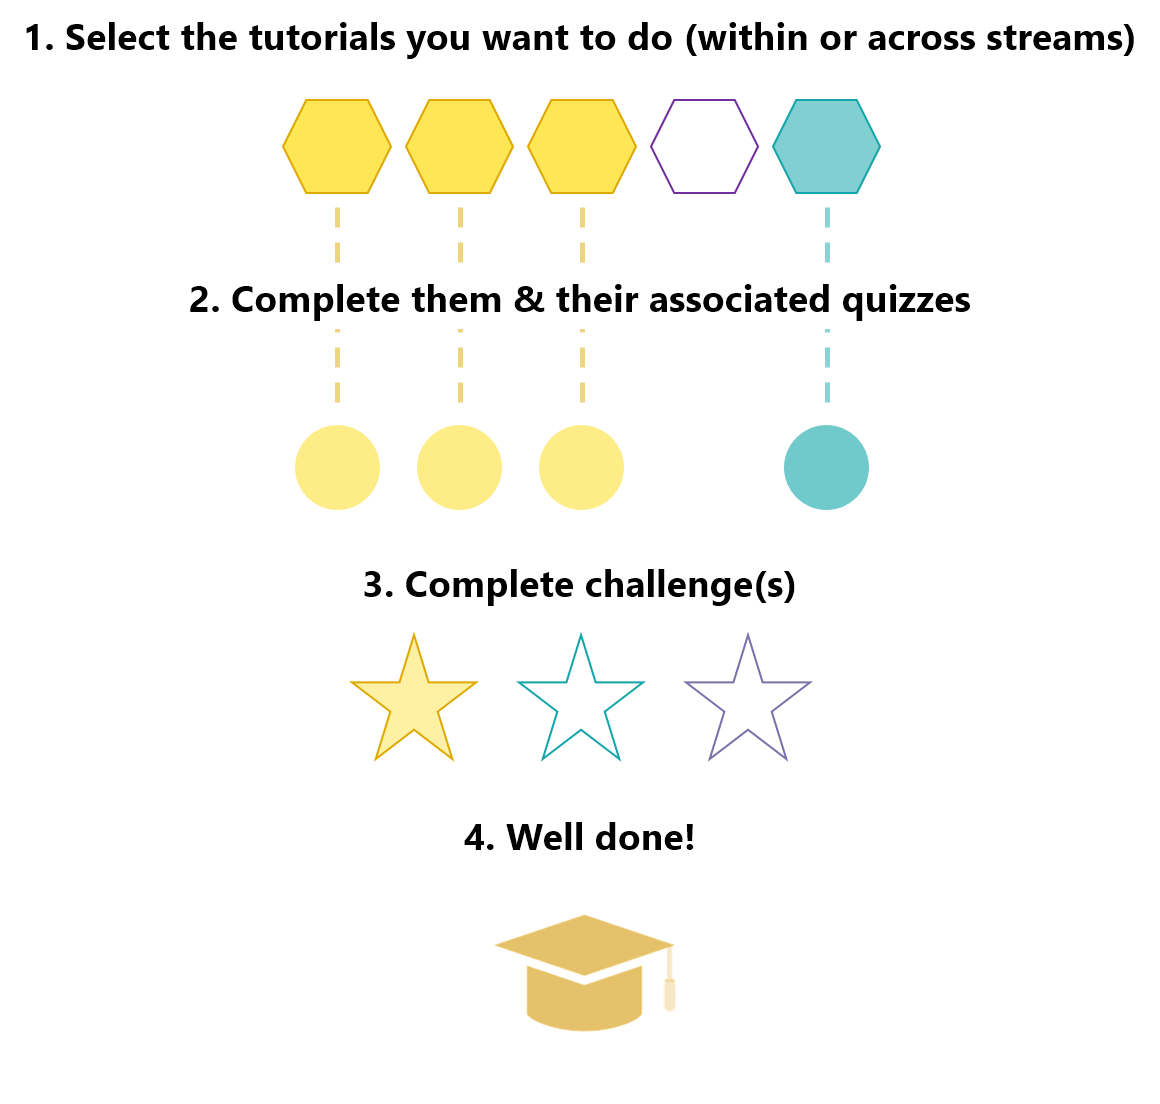
We hope you enjoy doing the course! There is no time limit for completion, so you can take it at your own pace. Each tutorial listed above might take you between one and three hours to complete, and your completion will be recorded once you take the quiz at the end. You can track your progression and access the course quizzes in our test centre.
You can download all the materials for this stream from our GitHub repository.
If you are not yet registered for the course, you will have to sign up first.
All done?
If you have finished the stream and would like to request a certificate, you can do so in a few clicks. Note that this will not exclude you from the course, so if you decide to come back for more our doors are still open!
Get in touch
Bee in your bonnet? Technical issues? Don't hesitate to get in touch with any questions or suggestions concerning the course. Please keep in mind that this is a brand new course and we are still testing and implementing some features, so if you notice errors or some areas of the site are not working as they should, please tell us!