Course details
Here you can find all the information you need to sign up for the course and choose which tutorials you want to complete. See our instructions on how best to access the course materials and how to test your new skills. We'll also introduce ourselves - don't hesitate to get in touch with questions or feedback!

1. Sign up
By registering for the course, you can access not only our tutorials but also quizzes and challenges that will allow you to put your skills into practice and request your certificate. Registering only takes a minute. Remember to make a note of your login details!
2. Choose your tutorials
You can mix and match across streams, but we have grouped tutorials under three popular topics targeting different levels and interests.
Stats from Scratch
Our (anything but) basic introduction to R and object-oriented programming. Ideal for those with no previous coding experience - by the end you will have coded your way through all the key elements of scientific research, from manipulating data to conducting simple statistical analyses and presenting results in professional-looking graphs.
Wiz of Data Viz
A picture is worth a thousand words! This stream is ideal for those with a bit of coding experience in R, but it recaps some key elements of data manipulation to make sure you're off to a strong start. Then it's all about making your science come to life with nice, informative figures and interactive elements such as Markdown reports and Shiny apps.
Mastering Modelling
All about the stats! Learn how to turn research questions into code, accounting for various data structures and types. This stream is ideal for those with some coding experience in R, but also offers entry-level spatial analysis with the Google Earth Engine.
3. Download the course materials
If you want to tackle a whole course stream (or most of it), we recommend that you download the relevant data repository from GitHub (no account required) and place it somewhere near the root of your computer (e.g. the "C" drive). That way, you have all the materials you need already in a clear folder structure.
- Data repository for Stream 1: Stats from Scratch
- Data repository for Stream 2: Wiz of Data Viz
- Data repository for Stream 3: Mastering Modelling
If you only plan on doing a couple of tutorials, then you may ignore this step and download the materials directly from the link provided in each tutorial.
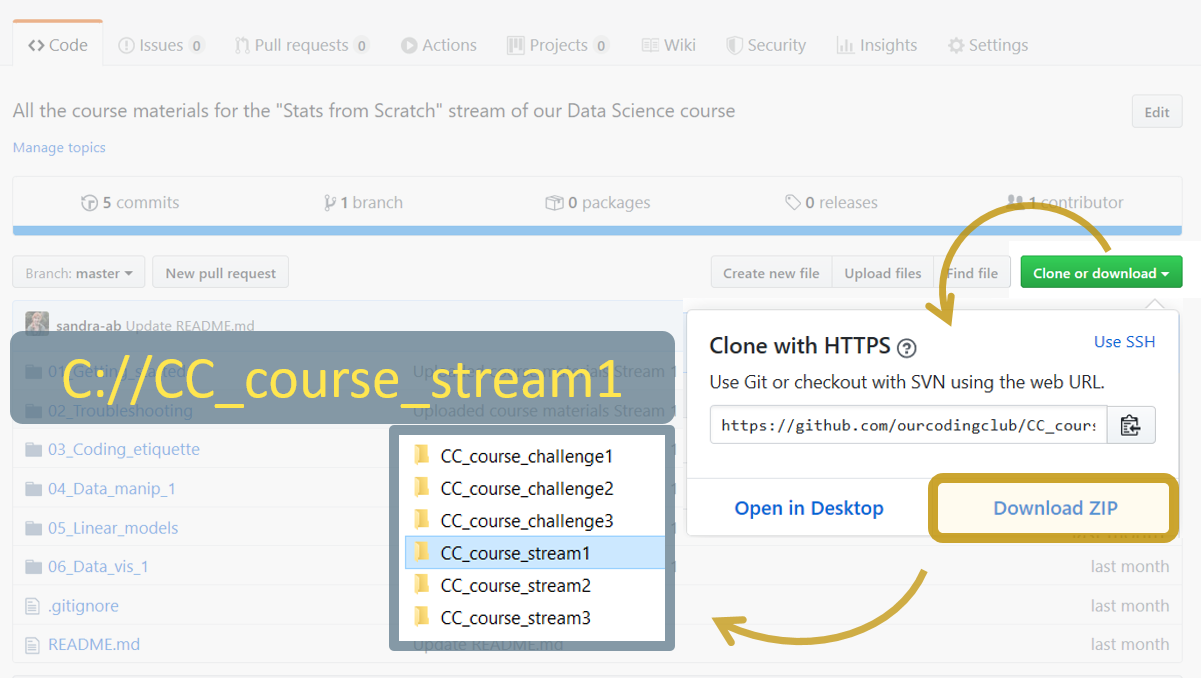
You can then access the files in RStudio by setting your working directory to a specific folder, or by creating a new R project within the desired folder (which will automatically set the working directory). We suggest that you save your new script and all other outputs from the tutorial (e.g. graphs) in that tutorial folder (e.g. your script for the first tutorial would be saved as C://CC_course_stream1/01_Getting_started/intro-to-R-script.R).
No idea what we're talking about? The very first tutorial of Stats from Scratch should demystify all this.
Are you a more advanced user keen on version control? Feel free to fork the repositories to your own Github account.
4. Learn!
Now you're all set to start working on the tutorials! You can find the list of tutorials on each stream page, along with the links to related quizzes and challenges.
An average tutorial takes around two hours to complete, although some may be longer or shorter. Make sure you save your script often as you go, so you can pick up where you left off if you don't finish a tutorial in one sitting. Our Intro to R and Coding Etiquette tutorials will tell you more about managing your code and scripts properly.
When you work on the tutorials, we recommend that you have RStudio open in one window with your script and the tutorial data, and follow along the tutorial online in another window.
Test yourself! When you finish a tutorial, go to our Test Centre to take the associated quiz. The quizzes are short and their purpose is for you to recap concepts you have learned, and for us to verify that you have engaged with the tutorial. Remember, we're not here to catch you out! Still, better to take the test right after the tutorial, while everything is still fresh.
Do as many tutorials as you like. This course runs continuously so there is no start or end date, and no time limit - ideal for learning alongside your many other commitments! When you request a certificate, all the tutorials and challenges you have completed will be listed on it. You can request a certificate at any point throughout the course, and if you end up doing more tutorials or challenges, you can request an updated certificate with all your new achievements included.

5. Challenge yourself
We offer three data challenges as the culmination of each course stream. In these challenges, we give you various research questions to answer, using real-life, open-source data from Scottish environmental organisations. The challenges are meant to be, well, challenging (!), and therefore we only provide minimal guidance. It will be up to you to make decisions and get creative with your code - there are usually more than one valid way of getting to an answer!
You don't need to have done every tutorial in a stream to succeed in the challenge, but you might want to refer back to them for reminders or useful snippets of code. Remember also that search engines are your friend and you are encouraged to look things up! Like with the tutorials, we test your completion of the challenge with a set of questions, with the difference that these questions are already made available to you on the challenge page.
Each challenge will probably take you anywhere between 3-8 hours to complete. Don't get frustrated if you get stuck somewhere: take a break, ask a friend or colleague for help, or get in touch with us. We want you to have fun and feel empowered: after all, you've worked hard and learned a lot!
Our data challenges
- Where are the red squirrels?
A data manipulation and analysis challenge for the Stats from Scratch stream - Exploring the native woodlands of Scotland
A spatial data visualisation challenge for the Wiz of Data Viz stream - Investigating seabirds breeding success
A modelling challenge for the Mastering Modelling stream

6. Get recognition
Congratulations! You worked hard, learned new skills, and perhaps you want to show the world (or a potential employer) how far you've come. You can request your certificate in a few clicks. You will be able to download your PDF certificate listing the tutorials and challenges that you have successfully completed.
About the course
What is the Coding Club?
Our Coding Club started in 2016 when a we, a group of students and staff members in Environmental and Ecological Sciences at the University of Edinburgh decided they wanted to learn more computer programming and quantitative methods than what they were being taught in class. Our goal is to overcome “code fear” and “statistics anxiety”. Statistics anxiety – the worry about a lack of quantitative skills – and code fear – the fear of programming – can hold people back in their studies and careers. We received funding to create coding tutorials and run weekly workshops that rapidly became a success.
Our Coding Club workshops are a relaxed and fun learning environment for undergraduate students, postgraduates, and staff alike, but our impact reaches far beyond Edinburgh. Users worlwide access our tutorials, and other universities have created their own coding clubs based on our model.
Why a course?
We created the course to offer a semi-structured approach to learning programming. Instead of lectures, we rely on practical problem-solving with our tutorials, which are designed to be relaxed and informal, developing “skills without the intimidation factor”, but with clear and measurable learning objectives in mind. Similarly, we designed the course streams to progressively build up your skills and develop a toolkit suited to your studies or professional requirements. You will rapidly gain confidence as you tackle increasingly complex and varied datasets and tasks.
We strongly believe that anyone can code and pride ourselves on offering a highly flexible and free course so that you can participate regardless of your occupation or financial situation. Our tutorials are written by a very diverse team and we want to see that diversity represented in the next generation of environmental data scientists!
We are able to provide this course completely free of charge thanks to the support of the Data Lab, Scotland's Innovation Centre for data and AI.

Get in touch
Bee in your bonnet? Technical issues? Don't hesitate to get in touch with any questions or suggestions concerning the course. Please keep in mind that this is a brand new course and we are still testing and implementing some features, so if you notice errors or some areas of the site are not working as they should, please tell us!

