Tutorial Aims:
Key steps
Each step is explained in detail as you start going through the workshop resources below. Have a quick read. There is no need to click on links or download things right now, this is just an outline so that you know what is ahead of you. You can use this list as a reference to track how far through the workshop you are.
Part 1: Becoming familiar with the Coding Club model.
Step 1. Individually or in small groups, complete a brief Coding Club tutorial about quantifying and mapping vertebrate population change in Europe.
Part 2: In small groups, create your own tutorial.
Step 1. Choose a topic for your tutorial from the list we’ve collated Each demonstrator will help out the group that has chosen the topic they contributed.
Step 2. Download the tutorial template file tut_template.md and the R scripts for the various tutorials from this GitHub repository (click on Clone/Download, Download Zip and unzip the files).
Step 3. Open the R script for your chosen topic, run through the code to get familiar with what it does and save any plots it generates.
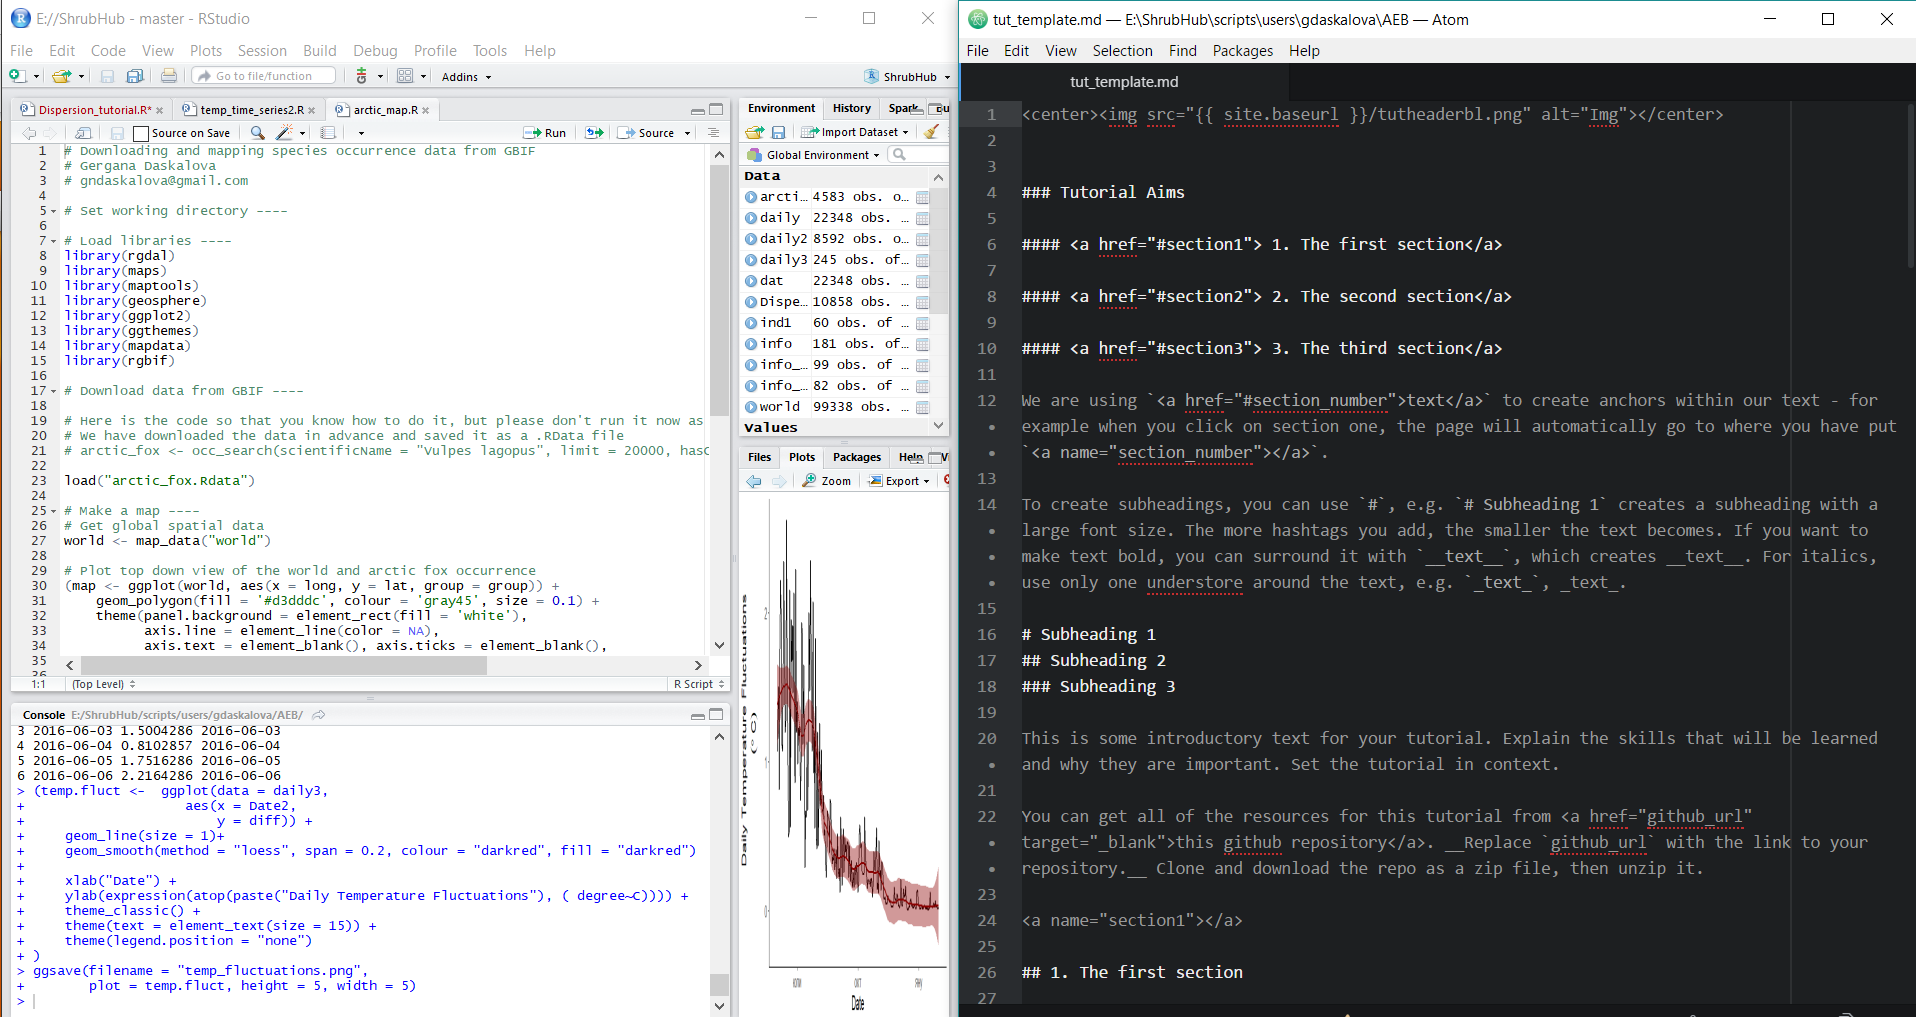
Step 4. Open tut_template.md in a plain text editor on half of your screen. Keep RStudio and the R script on the other half of the screen.
Step 5. Follow the template and instructions to create your tutorial. You need to copy the code from the R script to the template fle, add text to explain what your tutorial does and add the plots.
Step 6. Save your completed template file as index.md.
Step 7. Create a new repository on GitHub and upload index.md and your plots. Go to Settings, enable GitHub pages and you are done! Your tutorial is now live at the link thats shows up in the GitHub pages settings panel!
![]()
We started Coding Club to help people at all career stages gain statistical and programming fluency, facilitating the collective advancement of ecology across institutions and borders. We use in-person workshops and online tutorials to equip participants not only with new skills, but also with the means to communicate these new skills broadly via online tutorials.
We would love to extend Coding Club beyond the University of Edinburgh and create a supportive community of people keen to get better at coding and statistics! With that in mind, we present you with a workshop on how to write and share tutorials!

There are similar initiatives already in place, which is very exciting! For this workshop, we are thrilled to be collaborating with the Aberdeen Study Group, led by Francesca Mancini. The Aberdeen Study Group aims to foster a place where people can get together to work on their coding projects, help each other out and share their work, whilst also learning new skills. You can follow their adventures in coding and open science on Twitter.
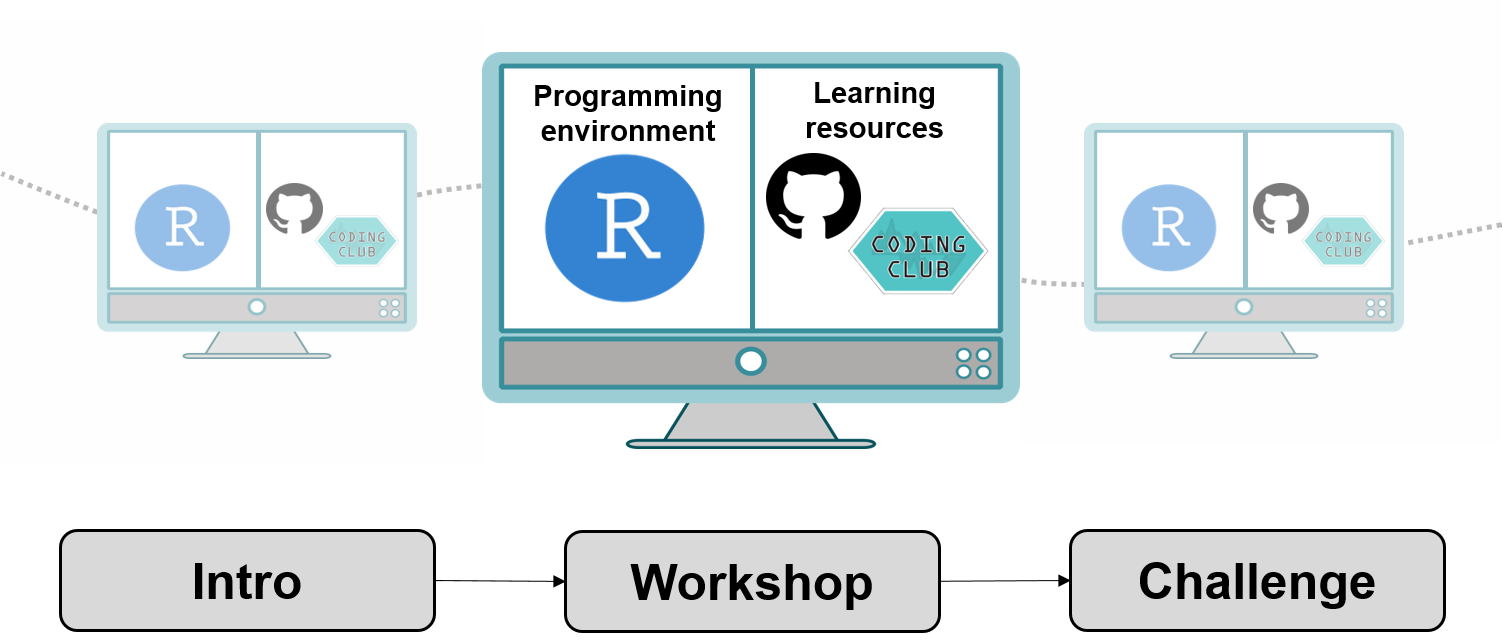
How does a Coding Club workshop work?
There are many ways to run a coding workshop and different approaches might work better in different situations. Here is how we usually structure our workshops. The workshops take two hours and begin with a super short presentation or introductory talk about what we will be doing, what skills we will acquire and what they are useful for. We then direct workshop attendants to the link for the tutorial around which the workshop is focused. People usually open the tutorial on half of their screen and RStudio on the other half.
At each workshop, we have a team of demonstrators who are there to answer questions and help out. We find that it works well to let people go through the tutorial at their own pace and we usually walk around and check whether things are going fine. Most of the tutorials have challenges at the end, for which people can work individually or in small teams. We bring cookies, popcorn and other treats, occasionally make bad R jokes and try our best to make the atmosphere light and positive. We don’t require people to sign up and there are no obligations to attend all the workshops: people are free to attend whichever workshops are of interest to them. At the end of the workshops, we usually stay behind for a while in case people have any specific questions about their own coding projects.
Find out for yourself - complete a quick Coding Club tutorial
To get a taste of the Coding Club experience, you can complete a Coding Club tutorial on mapping vertebrate population change across Europe.
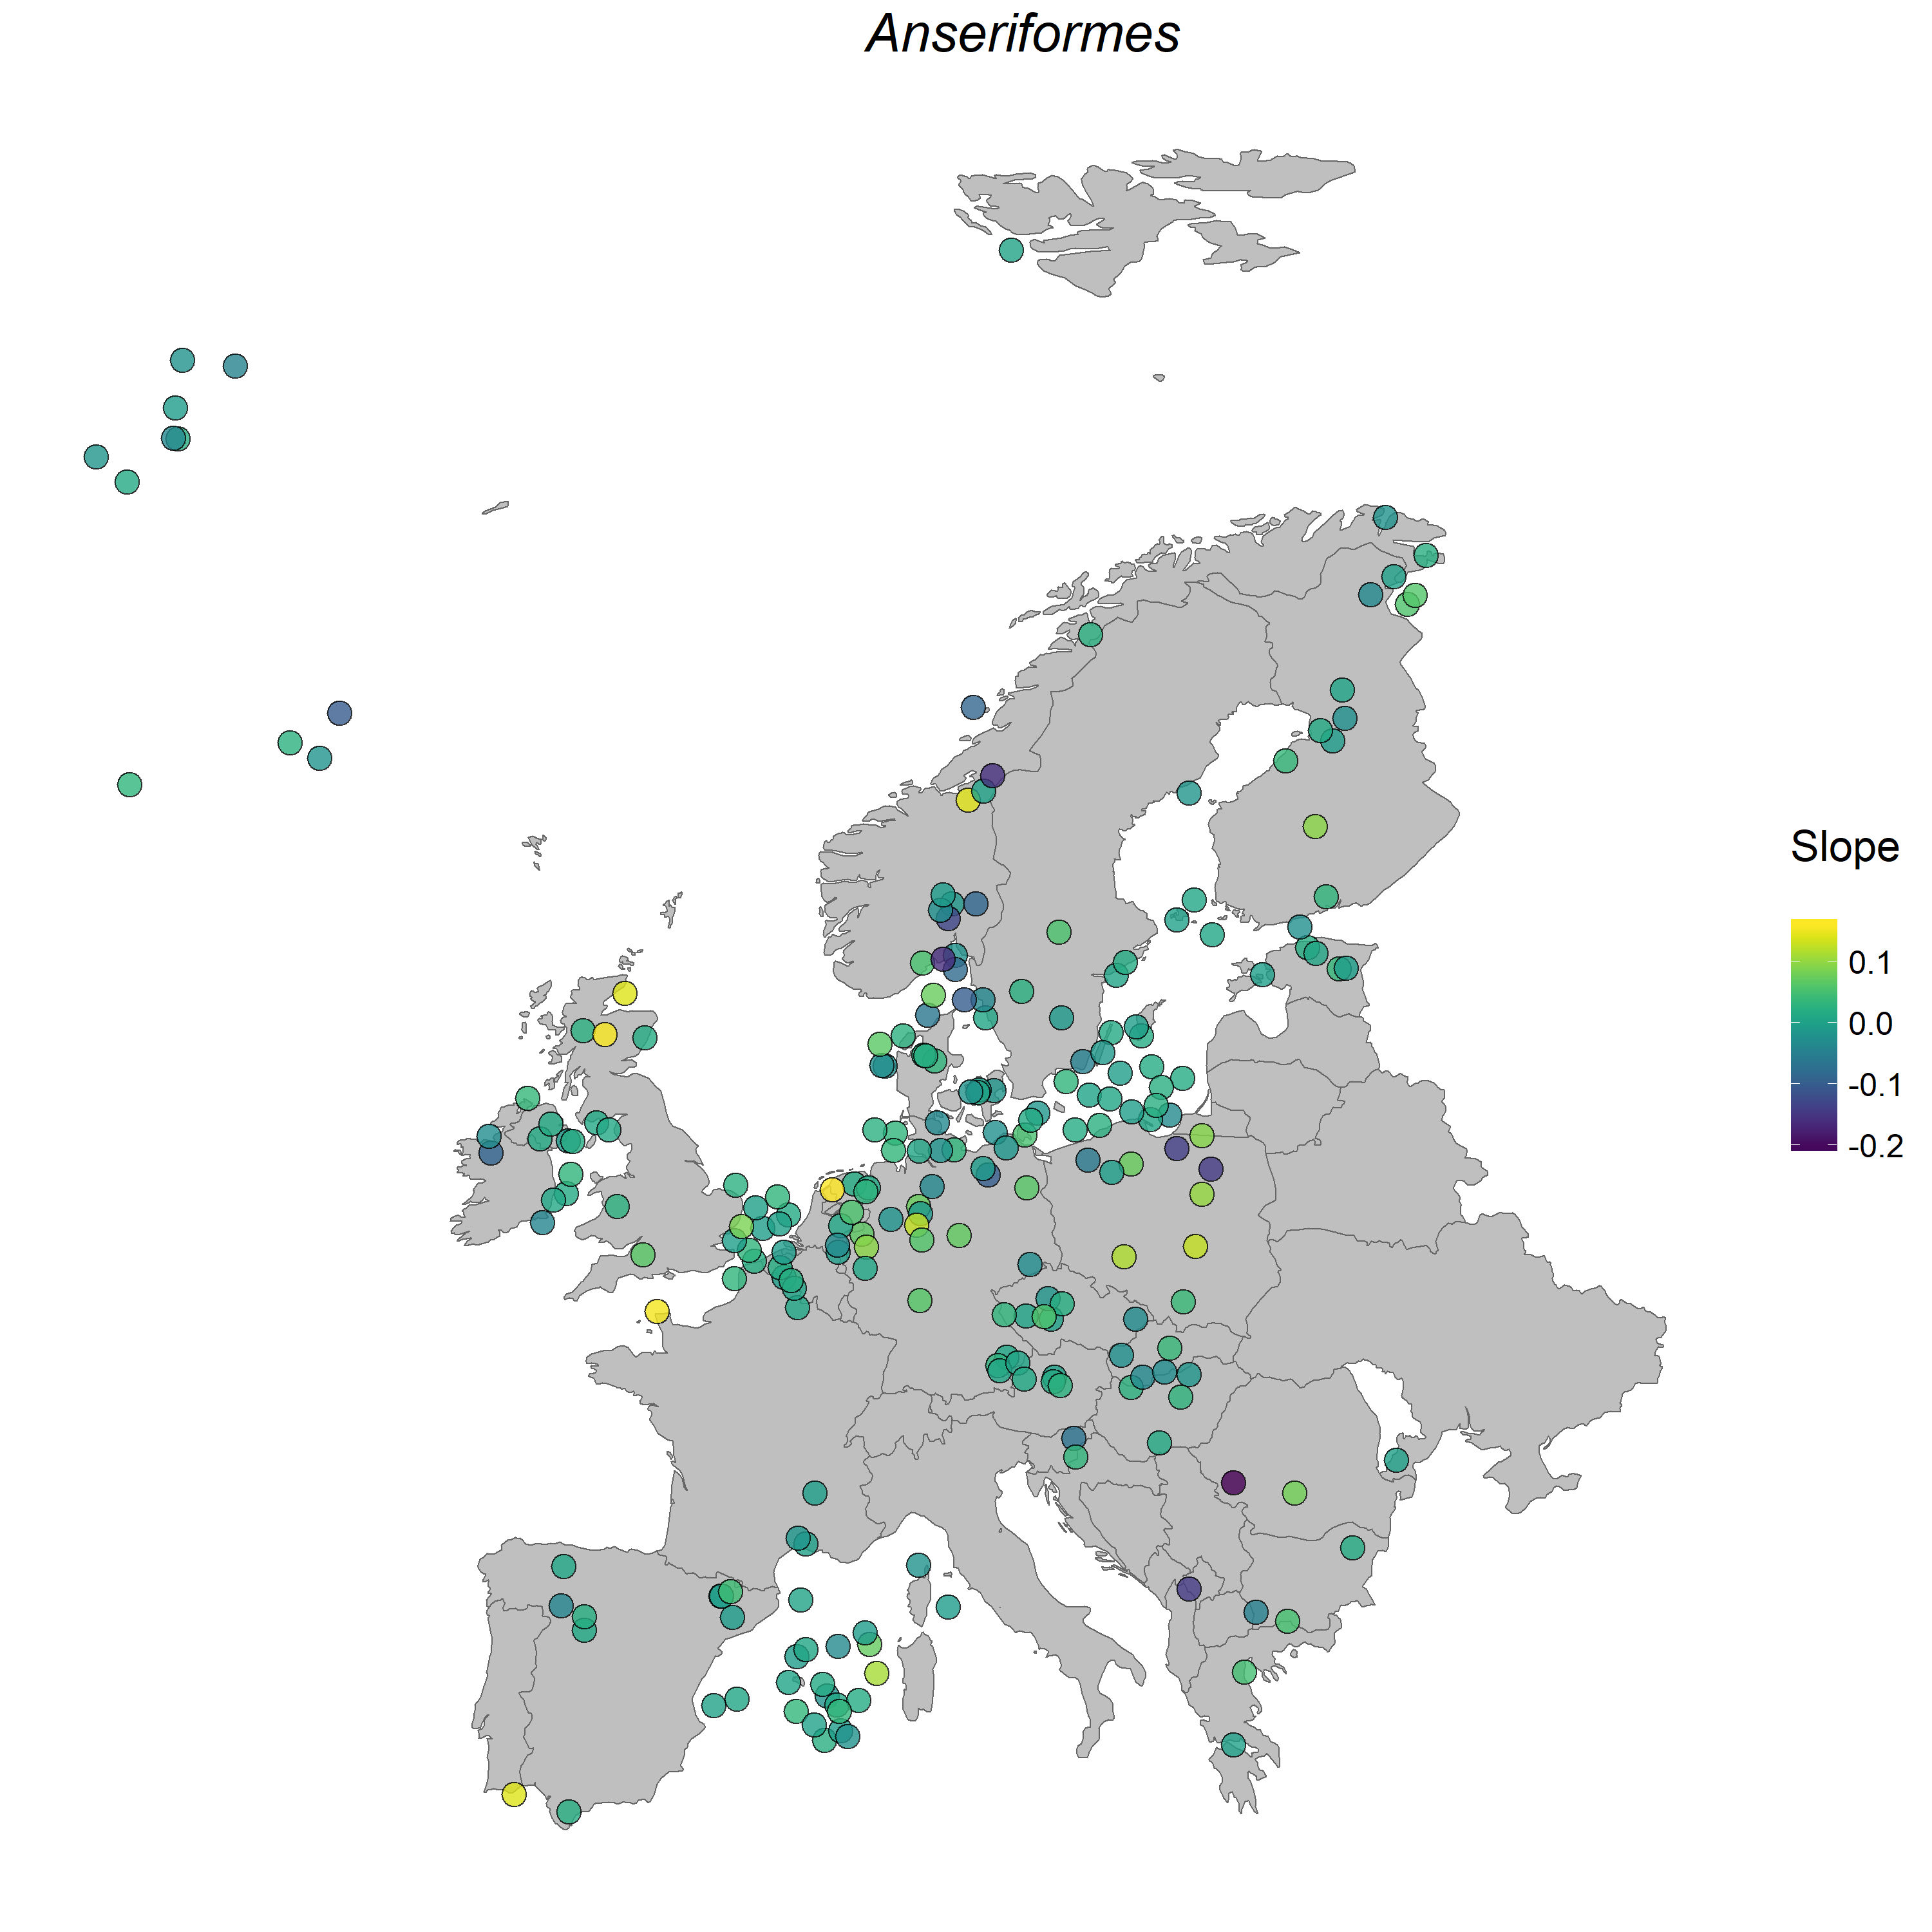 Anseriformes populations in Europe.
Write your own tutorial
Next we will learn how to write, format and publish coding tutorials.
We write our tutorials in Markdown. Markdown is a language with plain text formatting syntax. Github and Markdown work very well together and we use Markdown because we can turn a Markdown file into a website hosted on Github in a minute or so! Because of the syntax formatting, Markdown is a great way to display code: the code appears in chunks and stands out from the rest of the text. All of the Coding Club tutorials are written in Markdown.
We use the Atom text editor, which is a user-friendly text editor and easy on the eyes. You can use another text editor, like Brackets or TextEdit on a Mac and Notepad on a Windows computer if you prefer, the principle is the same. A plain text editor is a programme, which allow you to create, save and edit various types of text files, like .txt and in our case, Markdown (.md) files. So for example, Microsoft Word is a text editor, but not a plain one. In the “fancier” plain text editors, you get “syntax” highlighting: different types of text, like code and links, are colour coded so they are easier to spot.
You can download Atom here, if you wish.
Our workflow tends to go like this:
- Write the
Rcode for the tutorial inRStudio - Save any graphs you create with your code
- Open
Atom, copy and paste yourRcode in a new file - Save the file as a
.mdfile, e.g.datavis.md - Add text to explain the purpose of the tutorial and what the code does
- Add images and links as suitable
Don’t worry if you’ve never used Atom or Markdown before. We have created a template you can open straight in Atom (or another plain text editor) and just insert your text, comments and images.
You can download the tut_template.md file that you can turn into a tutorial from this Github repository. Click on Clone/Download Zip, download the files and unzip them.
Open the file tut_template.md in Atom. The file includes instructions on how to add subheadings, links, code and images. We have prepared a few sample topics based on which you can write a brief tutorial. Please choose a topic by clicking on it, which will take you to all the files necessary to write the tutorial.
Here is a list of the sample topics you may choose to write a tutorial on:
- Mapping Arctic fox occurrence records
- Plotting the spatial clustering forest trees due to elephants
- Creating a density map of red squirrel occurrences
- Visualising daily temperature fluctuations
- Graphically summarising plant trait data
- Visualising photosynthetic activity within sunflecks
- Analysing paths of movement and spatial autocorrelation
Mapping species occurrence records
By Gergana Daskalova
The aims of this tutorial are to download species occurrence data from GBIF using the rgbif package and then plot the data. We will also learn how to create a map with a top-down view of the world, as the species we’ve chosen, Arctic fox, is found in the Northern hemisphere.
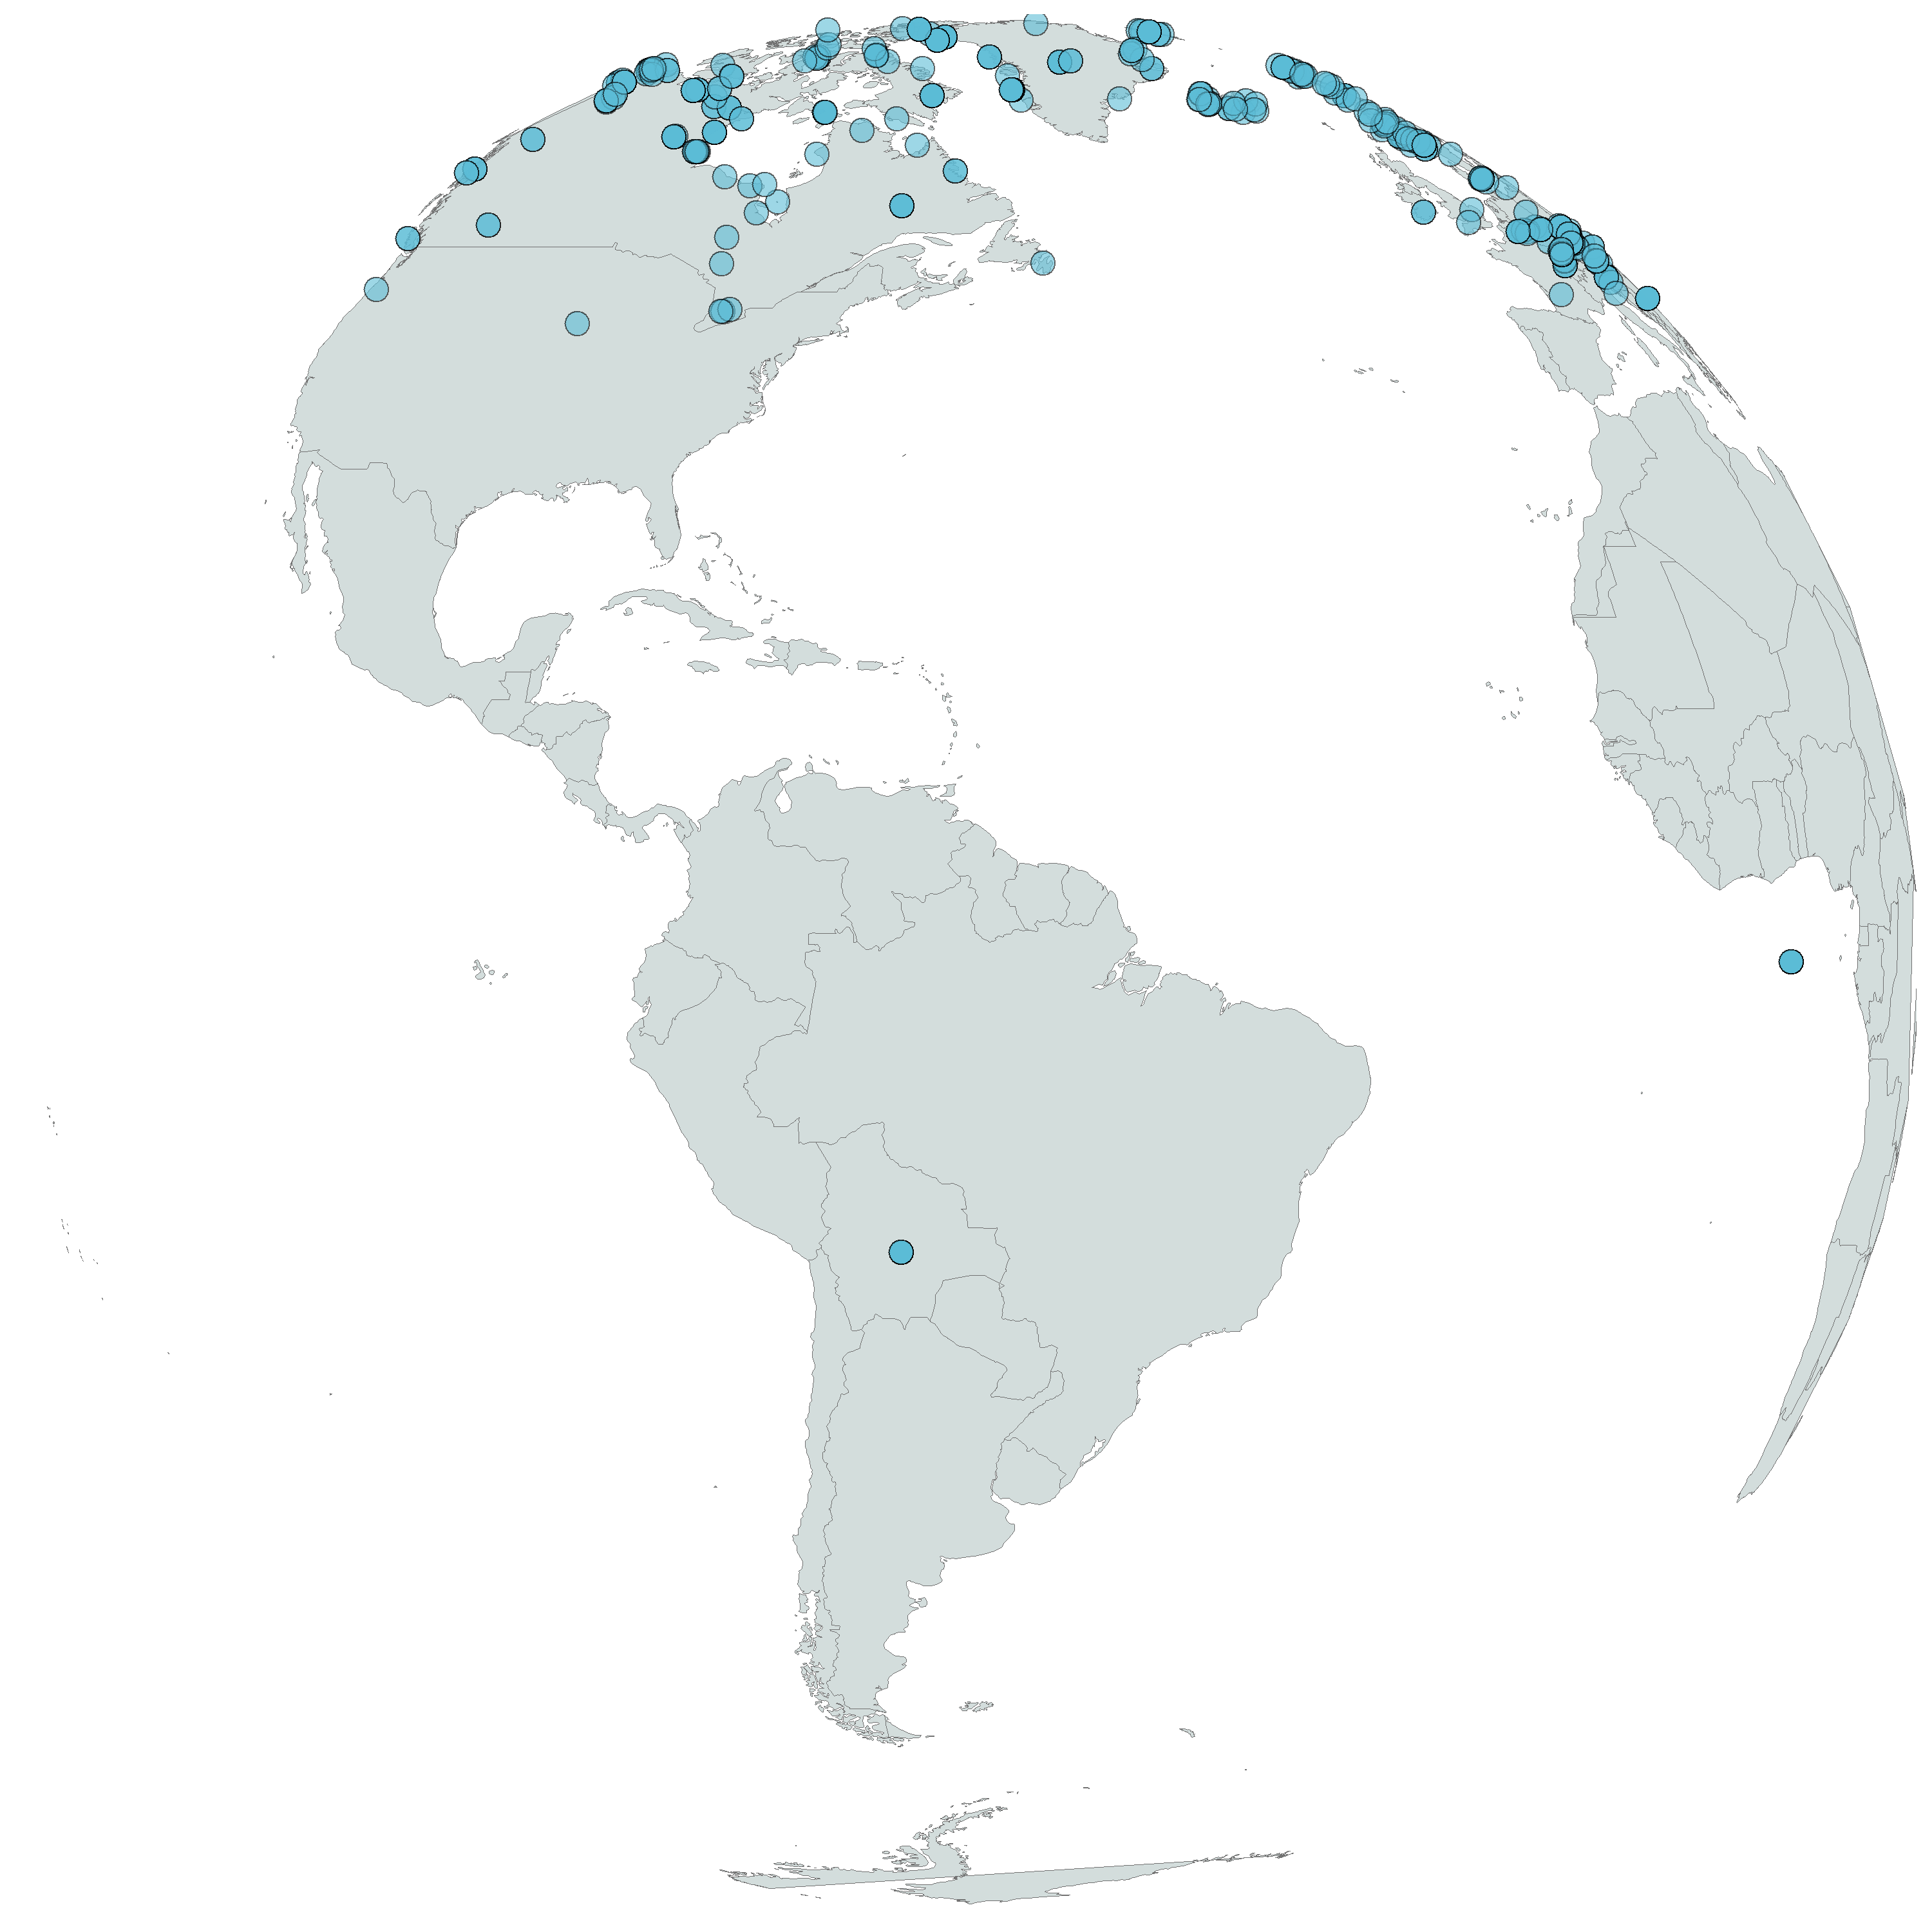 Arctic fox occurrences based on available data from the Global Biodiversity Information Facility (GBIF)
You can download the R script that you can turn into a tutorial from this Github repository. Click on Clone/Download Zip, download the files and unzip them. The script is the arctic_map.R file in the arctic_fox folder.
Visualising forest plot tree data
By John Godlee
This tutorial involves plotting tree inventory data from two permanent survey plots in a dry tropical savannah to see how spatial clustering of trees varies according to elephant activity. The tutorial covers the basics of using the ggplot2 package, using multiple layered visualisation methods to show variation in tree abundance over space. In addition, the tutorial will touch on simple skills in the immensely popular dplyr package to prepare datasets for use in data visualisation.
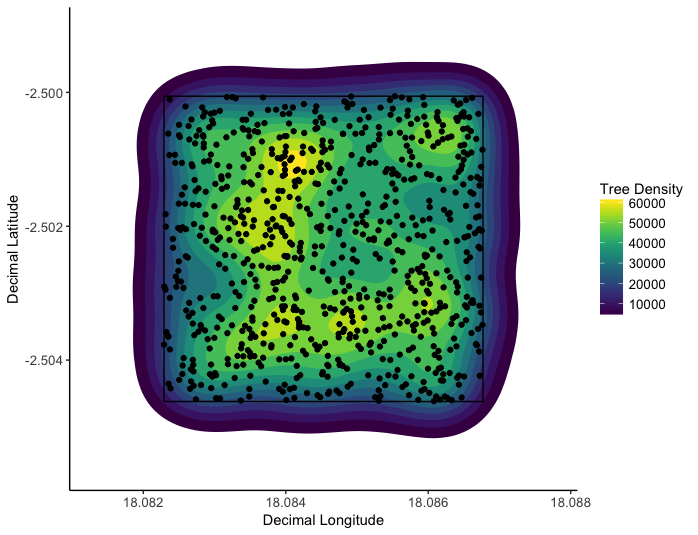 The spatial clustering of trees in a plot with elephant activity (left) and without elephant activity (right). Elephants clearly have caused spatial clustering of trees.
You can download the R script that you can turn into a tutorial from this Github repository. Click on Clone/Download Zip, download the files and unzip them. The data and script for this tutorial are in the savanna_elephants folder.
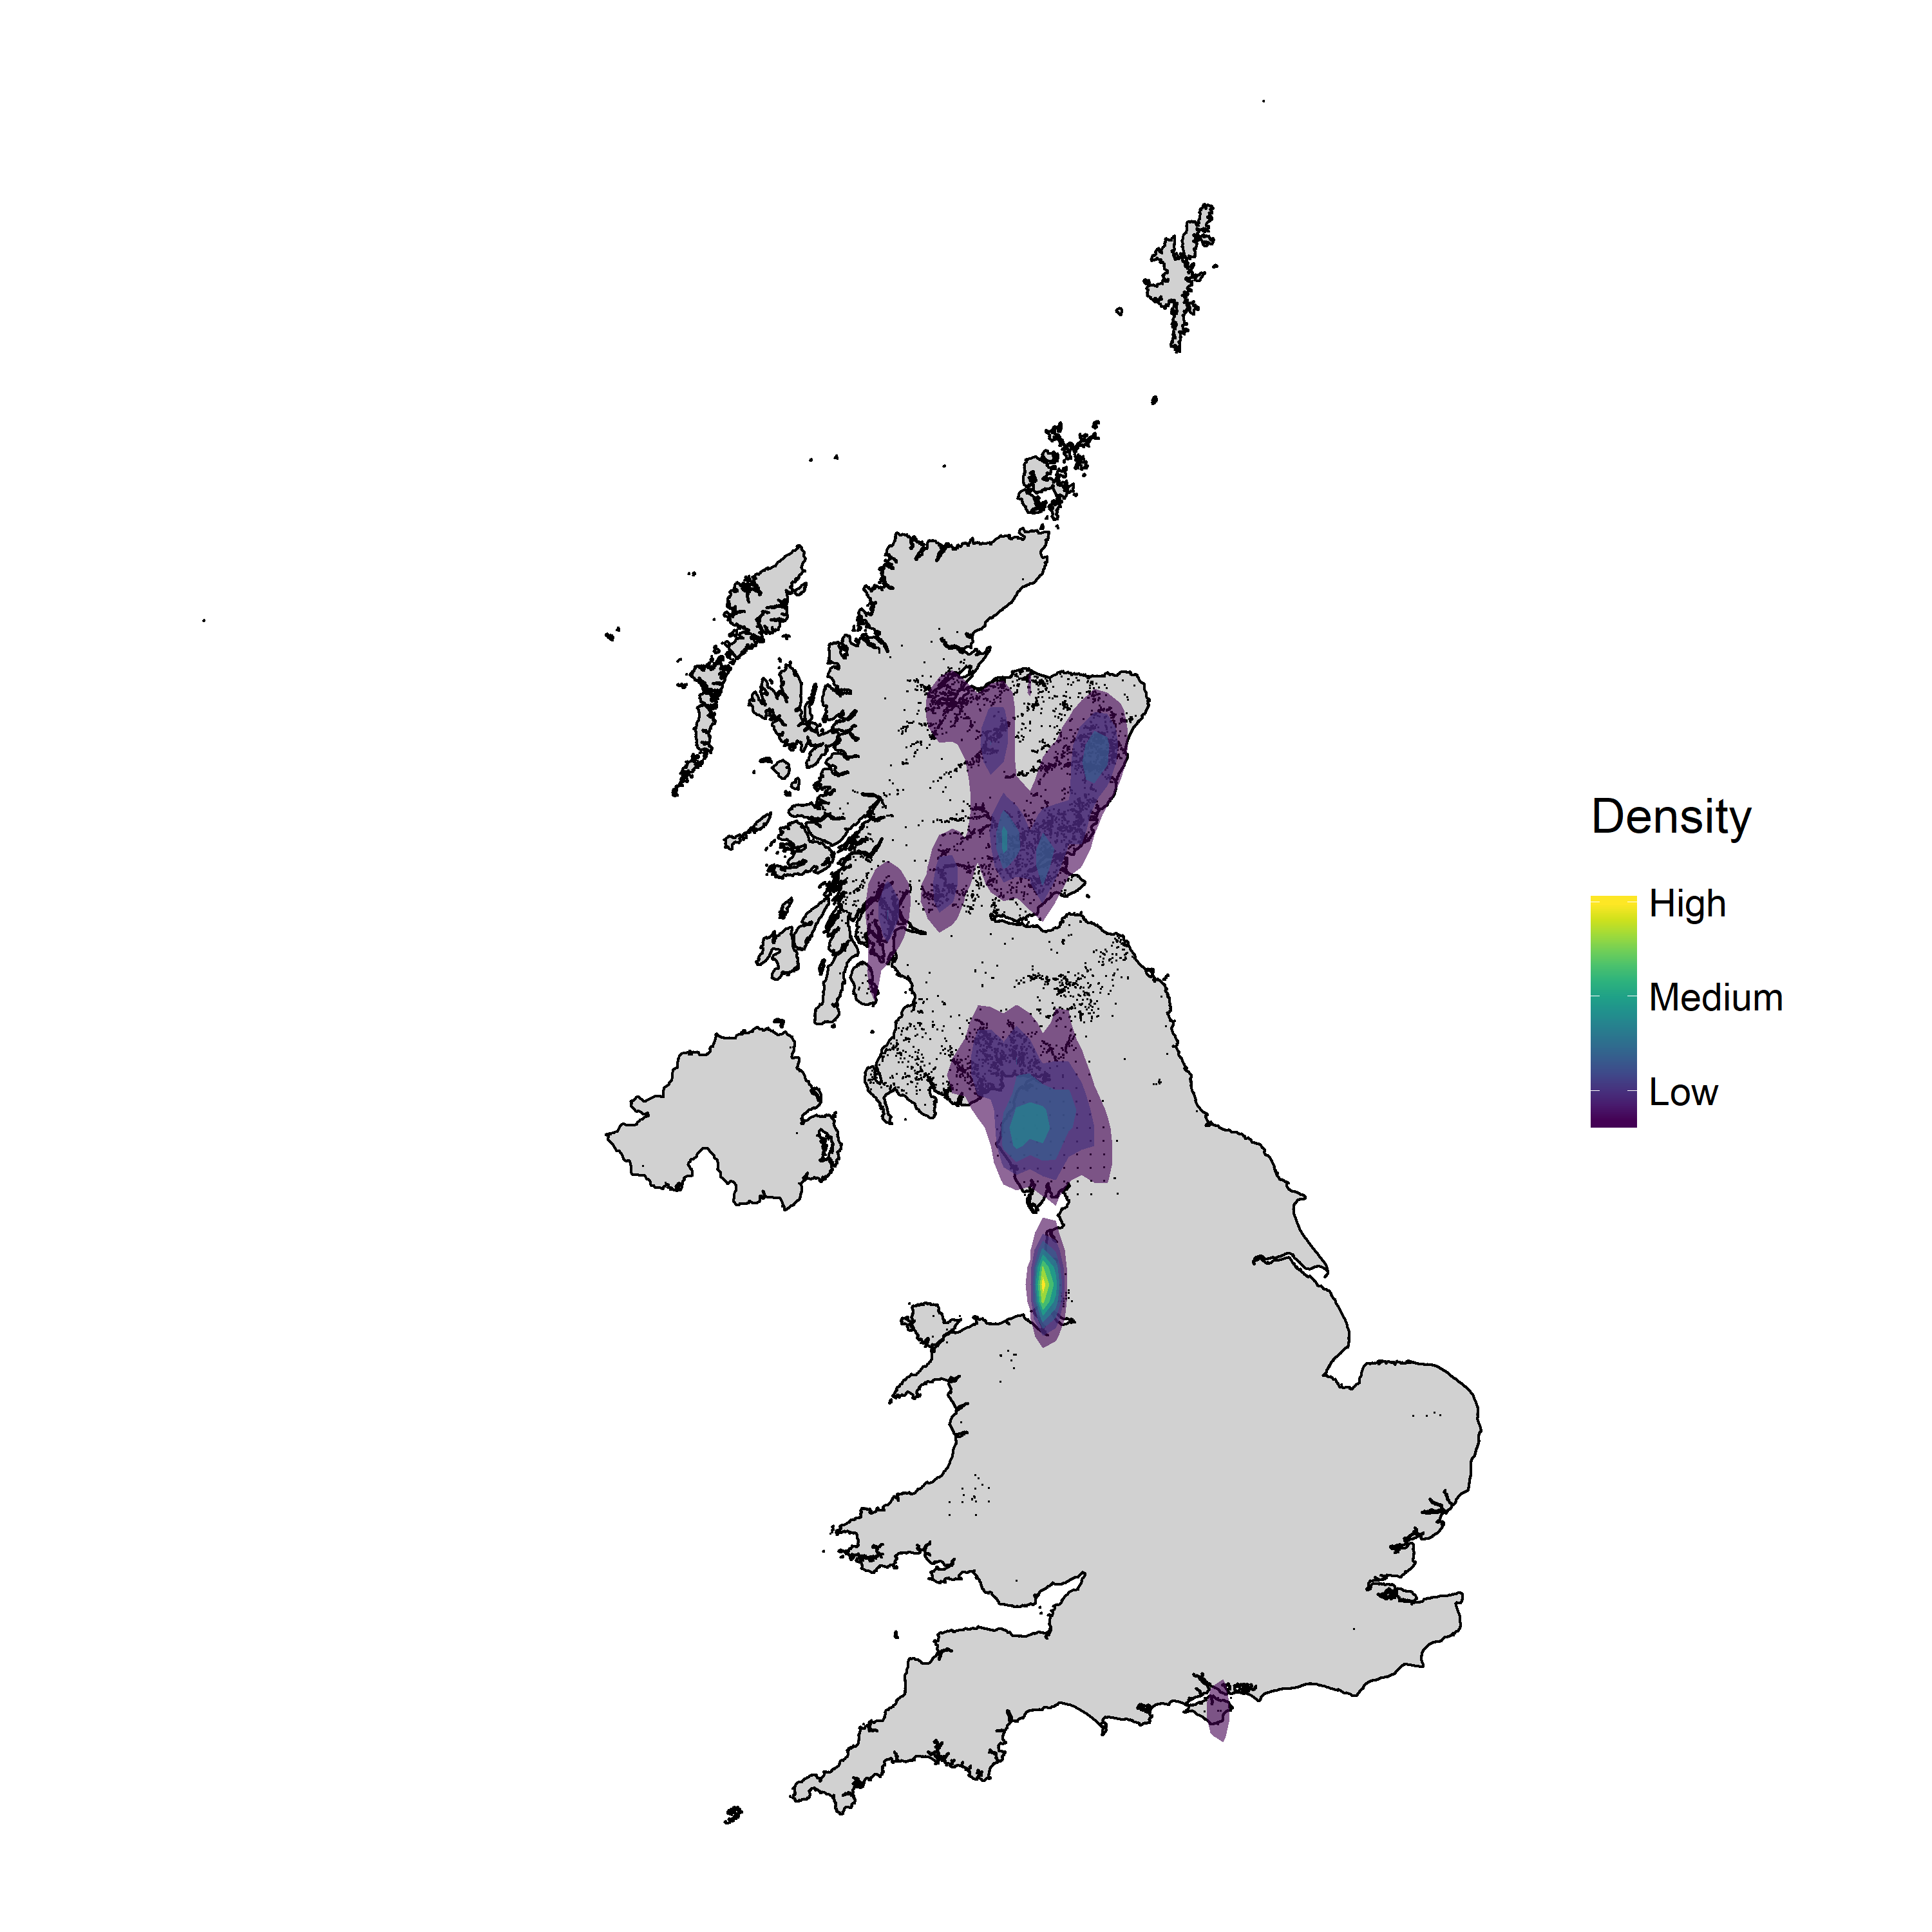
Density maps of red squirrel occurrences
By Francesca Mancini
The tutorial will take you through the steps of downloading red squirrel occurrences in the UK from the Global Biodiversity Information Facility (GBIF), adjusting spatial projections and plotting density maps with ggplot2.
You can download the R script that you can turn into a tutorial from this Github repository. Click on Clone/Download Zip, download the files and unzip them. The script for this tutorial density_maps.R is in the density_maps folder.
Visualising temperature timeseries data
By Anders Kolstrad
The aim of this tutorial is to produce a line graph or time series plot with mean daily temperature plus errors using ggplot2 and similarly, to produce a second graph of daily temperature fluctuations using a smoother function. Finally, we will plot and save the two figures together using the gridExtra package.
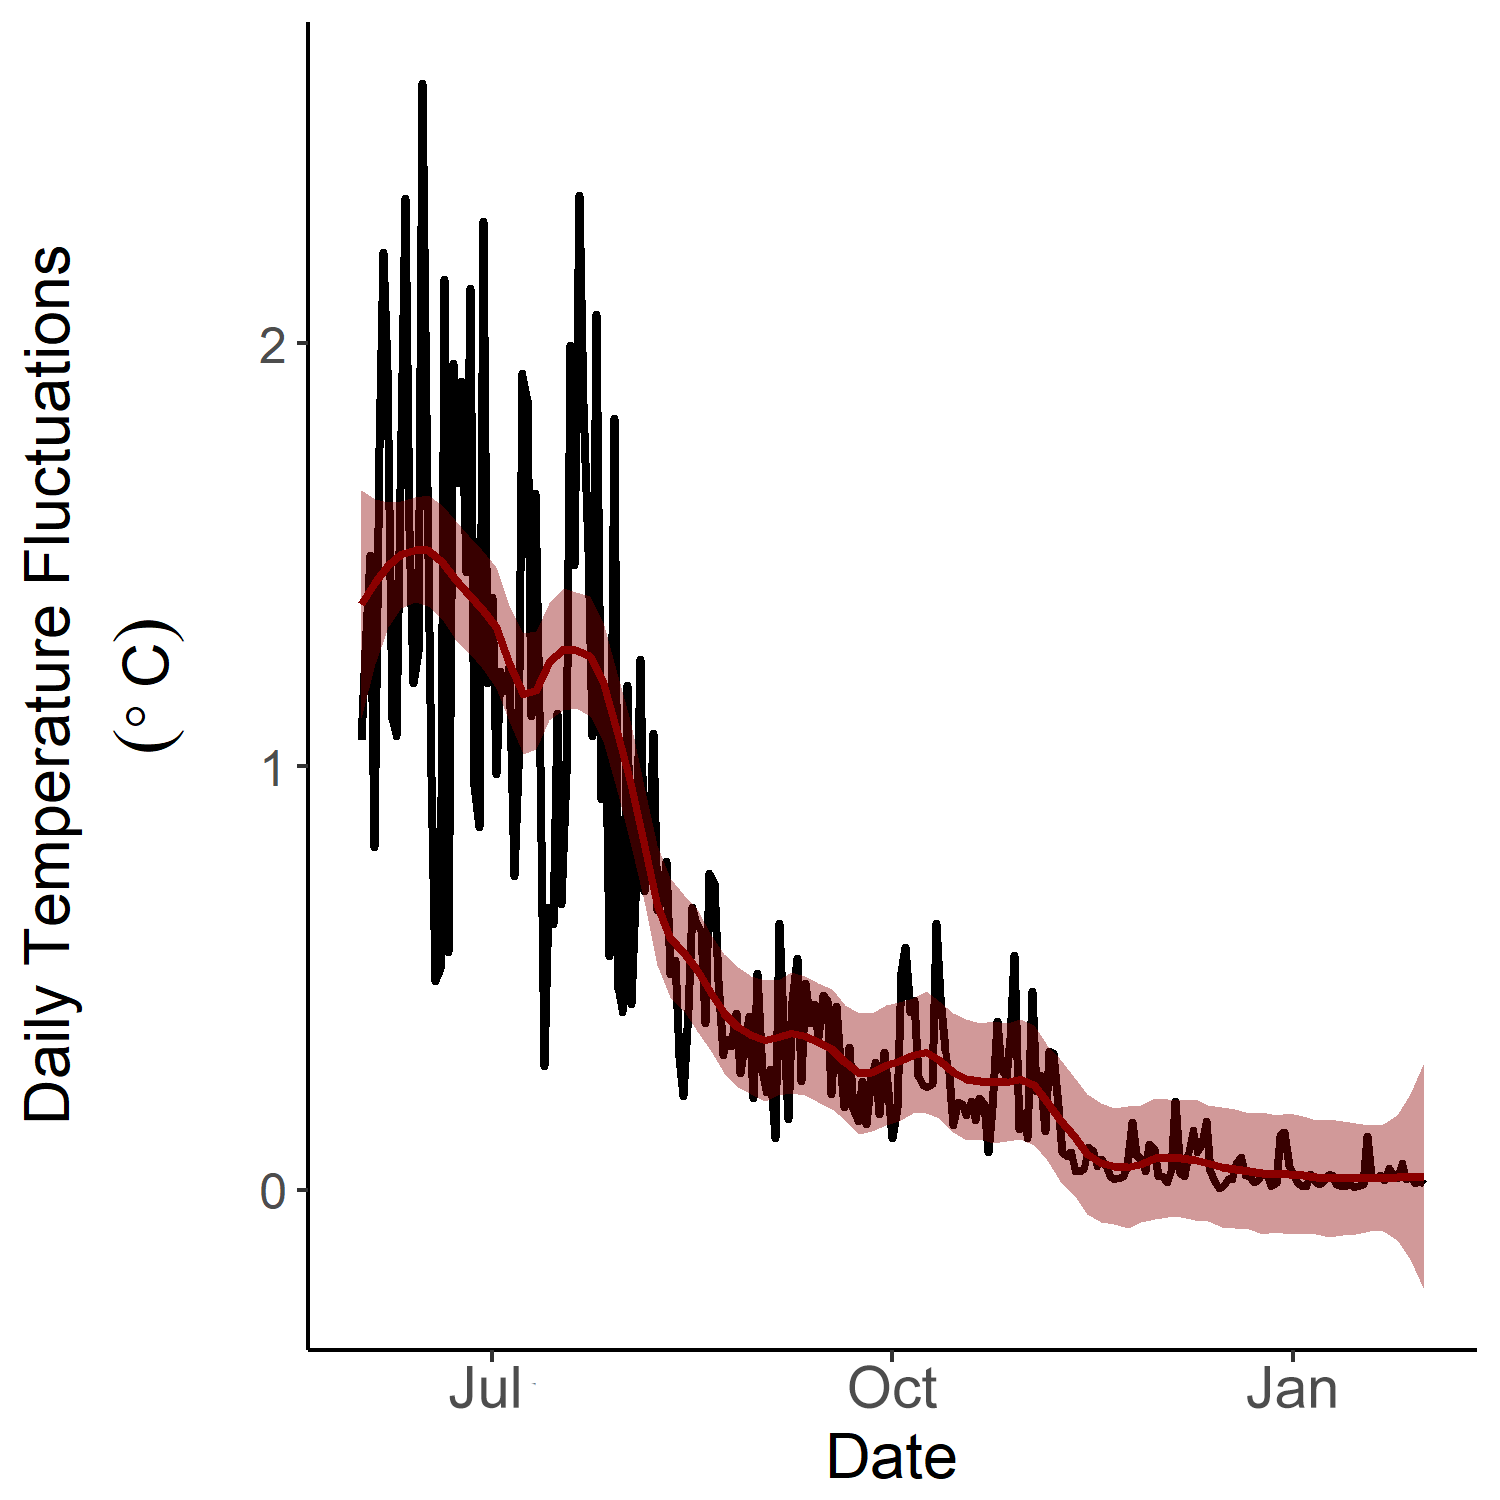 Daily temperature fluctuations in 2016.
You can download the R script that you can turn into a tutorial from this Github repository. Click on Clone/Download Zip, download the files and unzip them. The script for this tutorial temp_time_series.R is in the temp_timeseries folder.
Visualising trait-trait correlations and summarising plant traits across species
By Anne Bjorkman
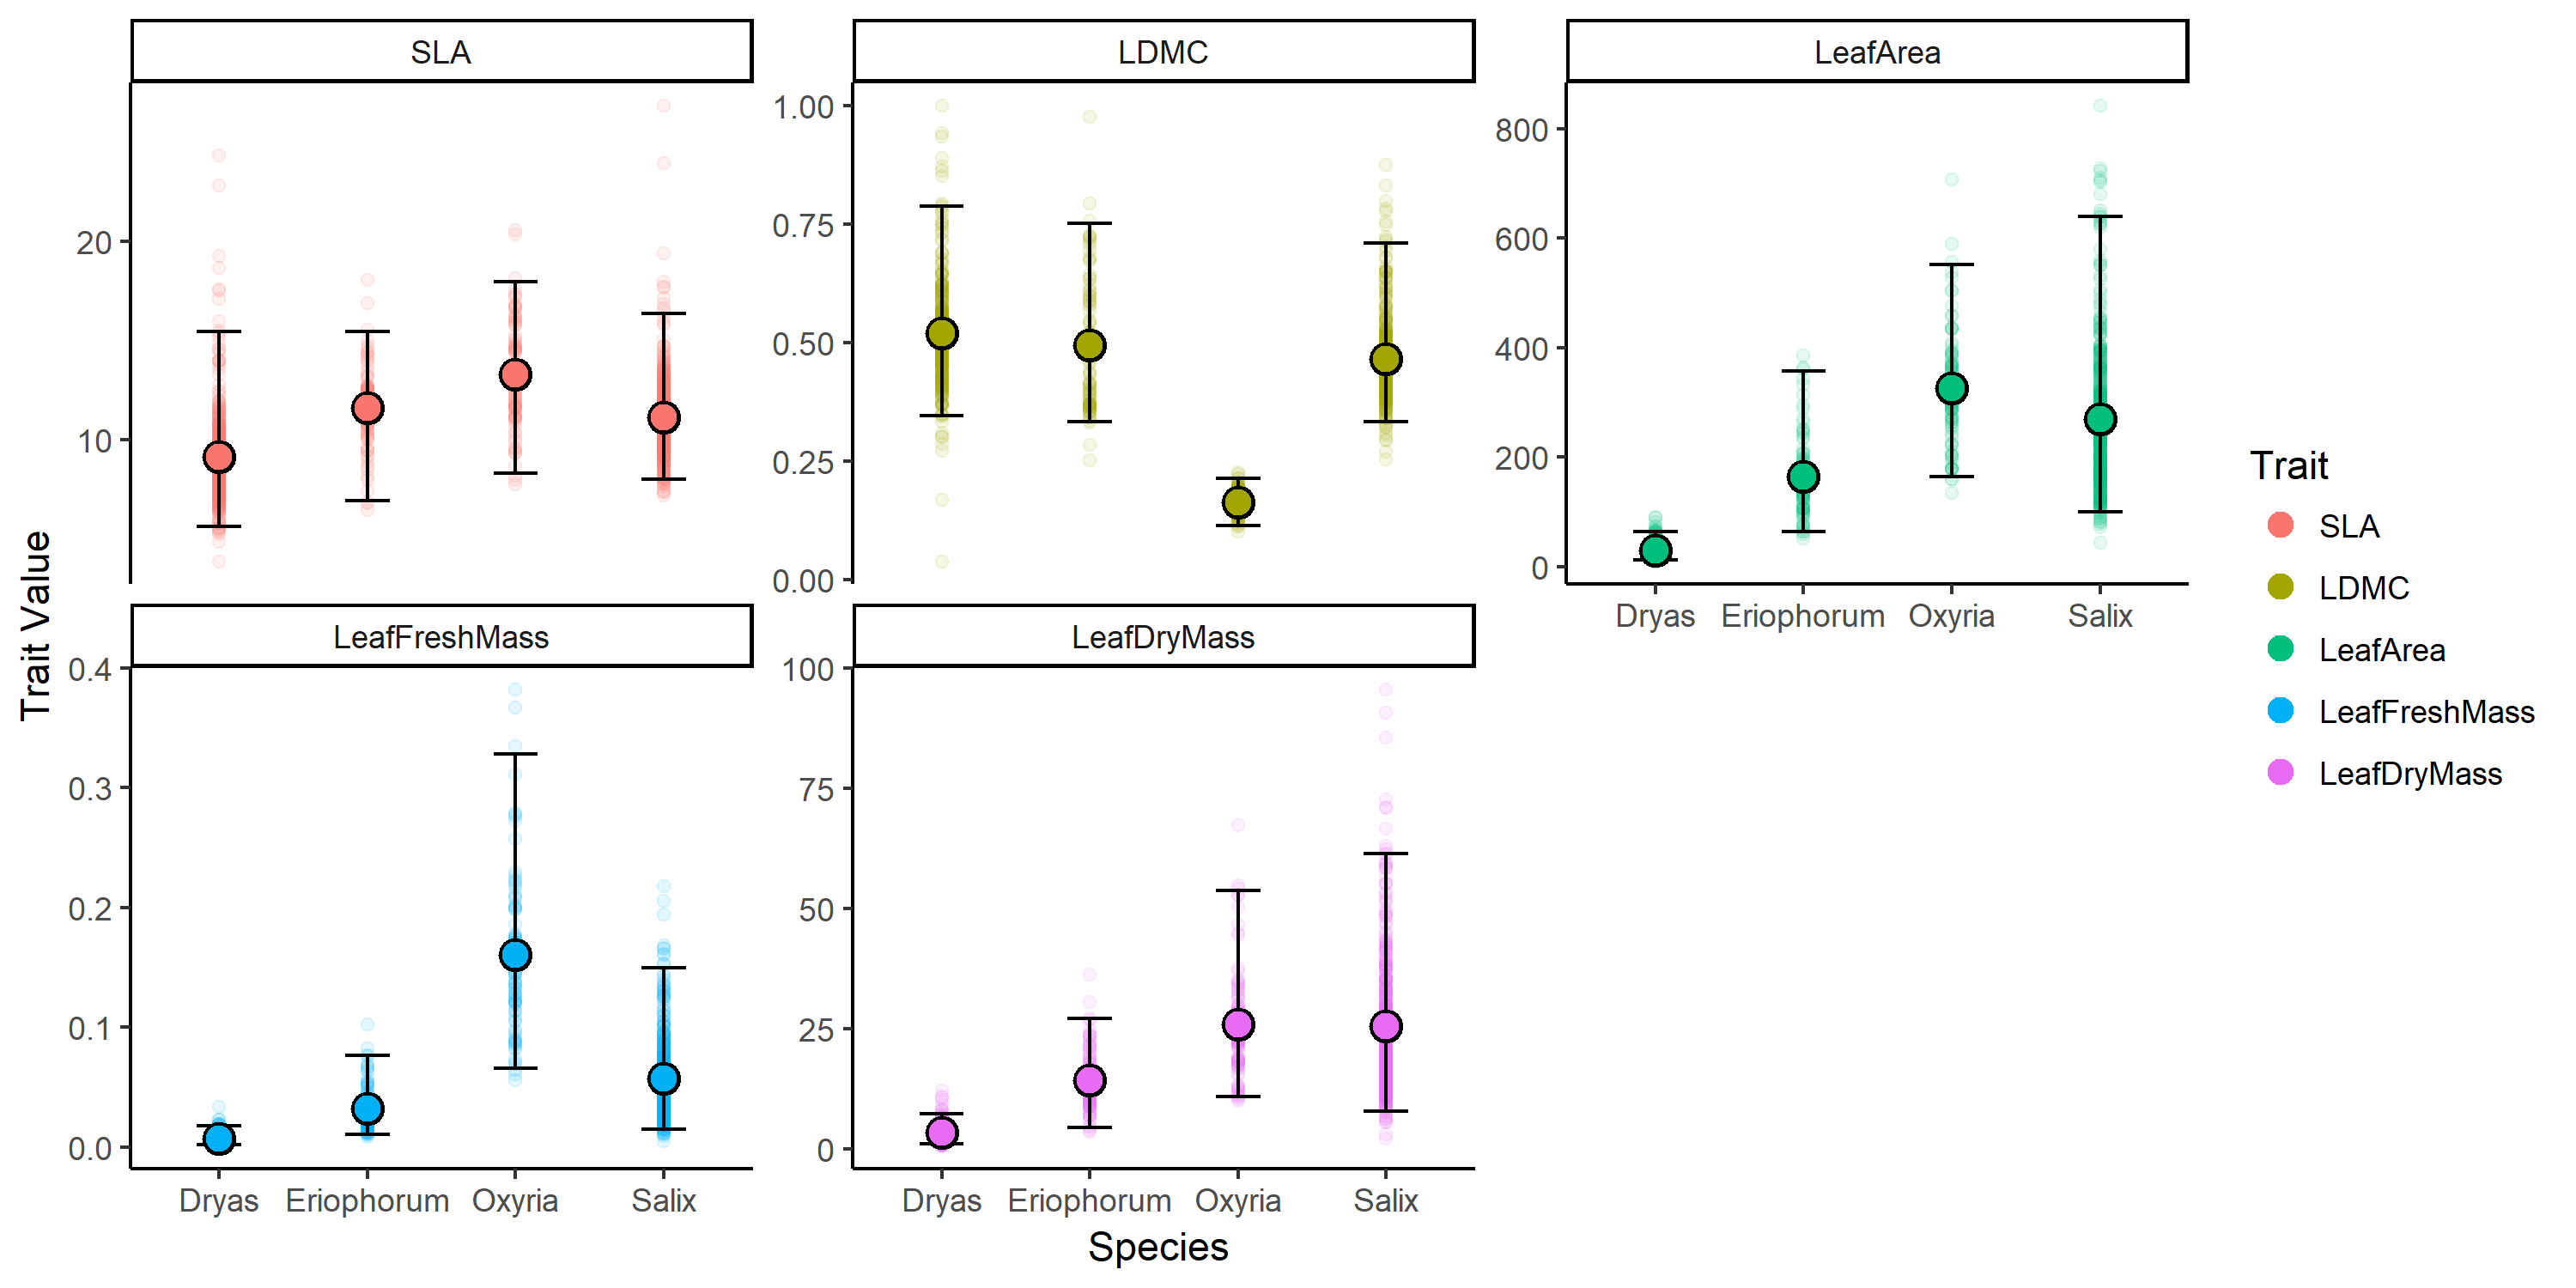 Plant traits across different species.
The aims of this tutorial are to create a trait-trait correlation plot using plant trait data in a wide format, then to convert this wide data format to long data format, to summarize the data (i.e., calculate a mean, max, min, range, and quantiles per trait and species) and finally to graph the raw and summarized data.
You can download the R script that you can turn into a tutorial from this Github repository. Click on Clone/Download Zip, download the files and unzip them. The script for this tutorial Plant_Traits.R and the data TraitData_CodingClub.RData are in the plant_traits folder.
Analysing leaf-level understorey photosynthesis within sunflecks
Dries Landuyt
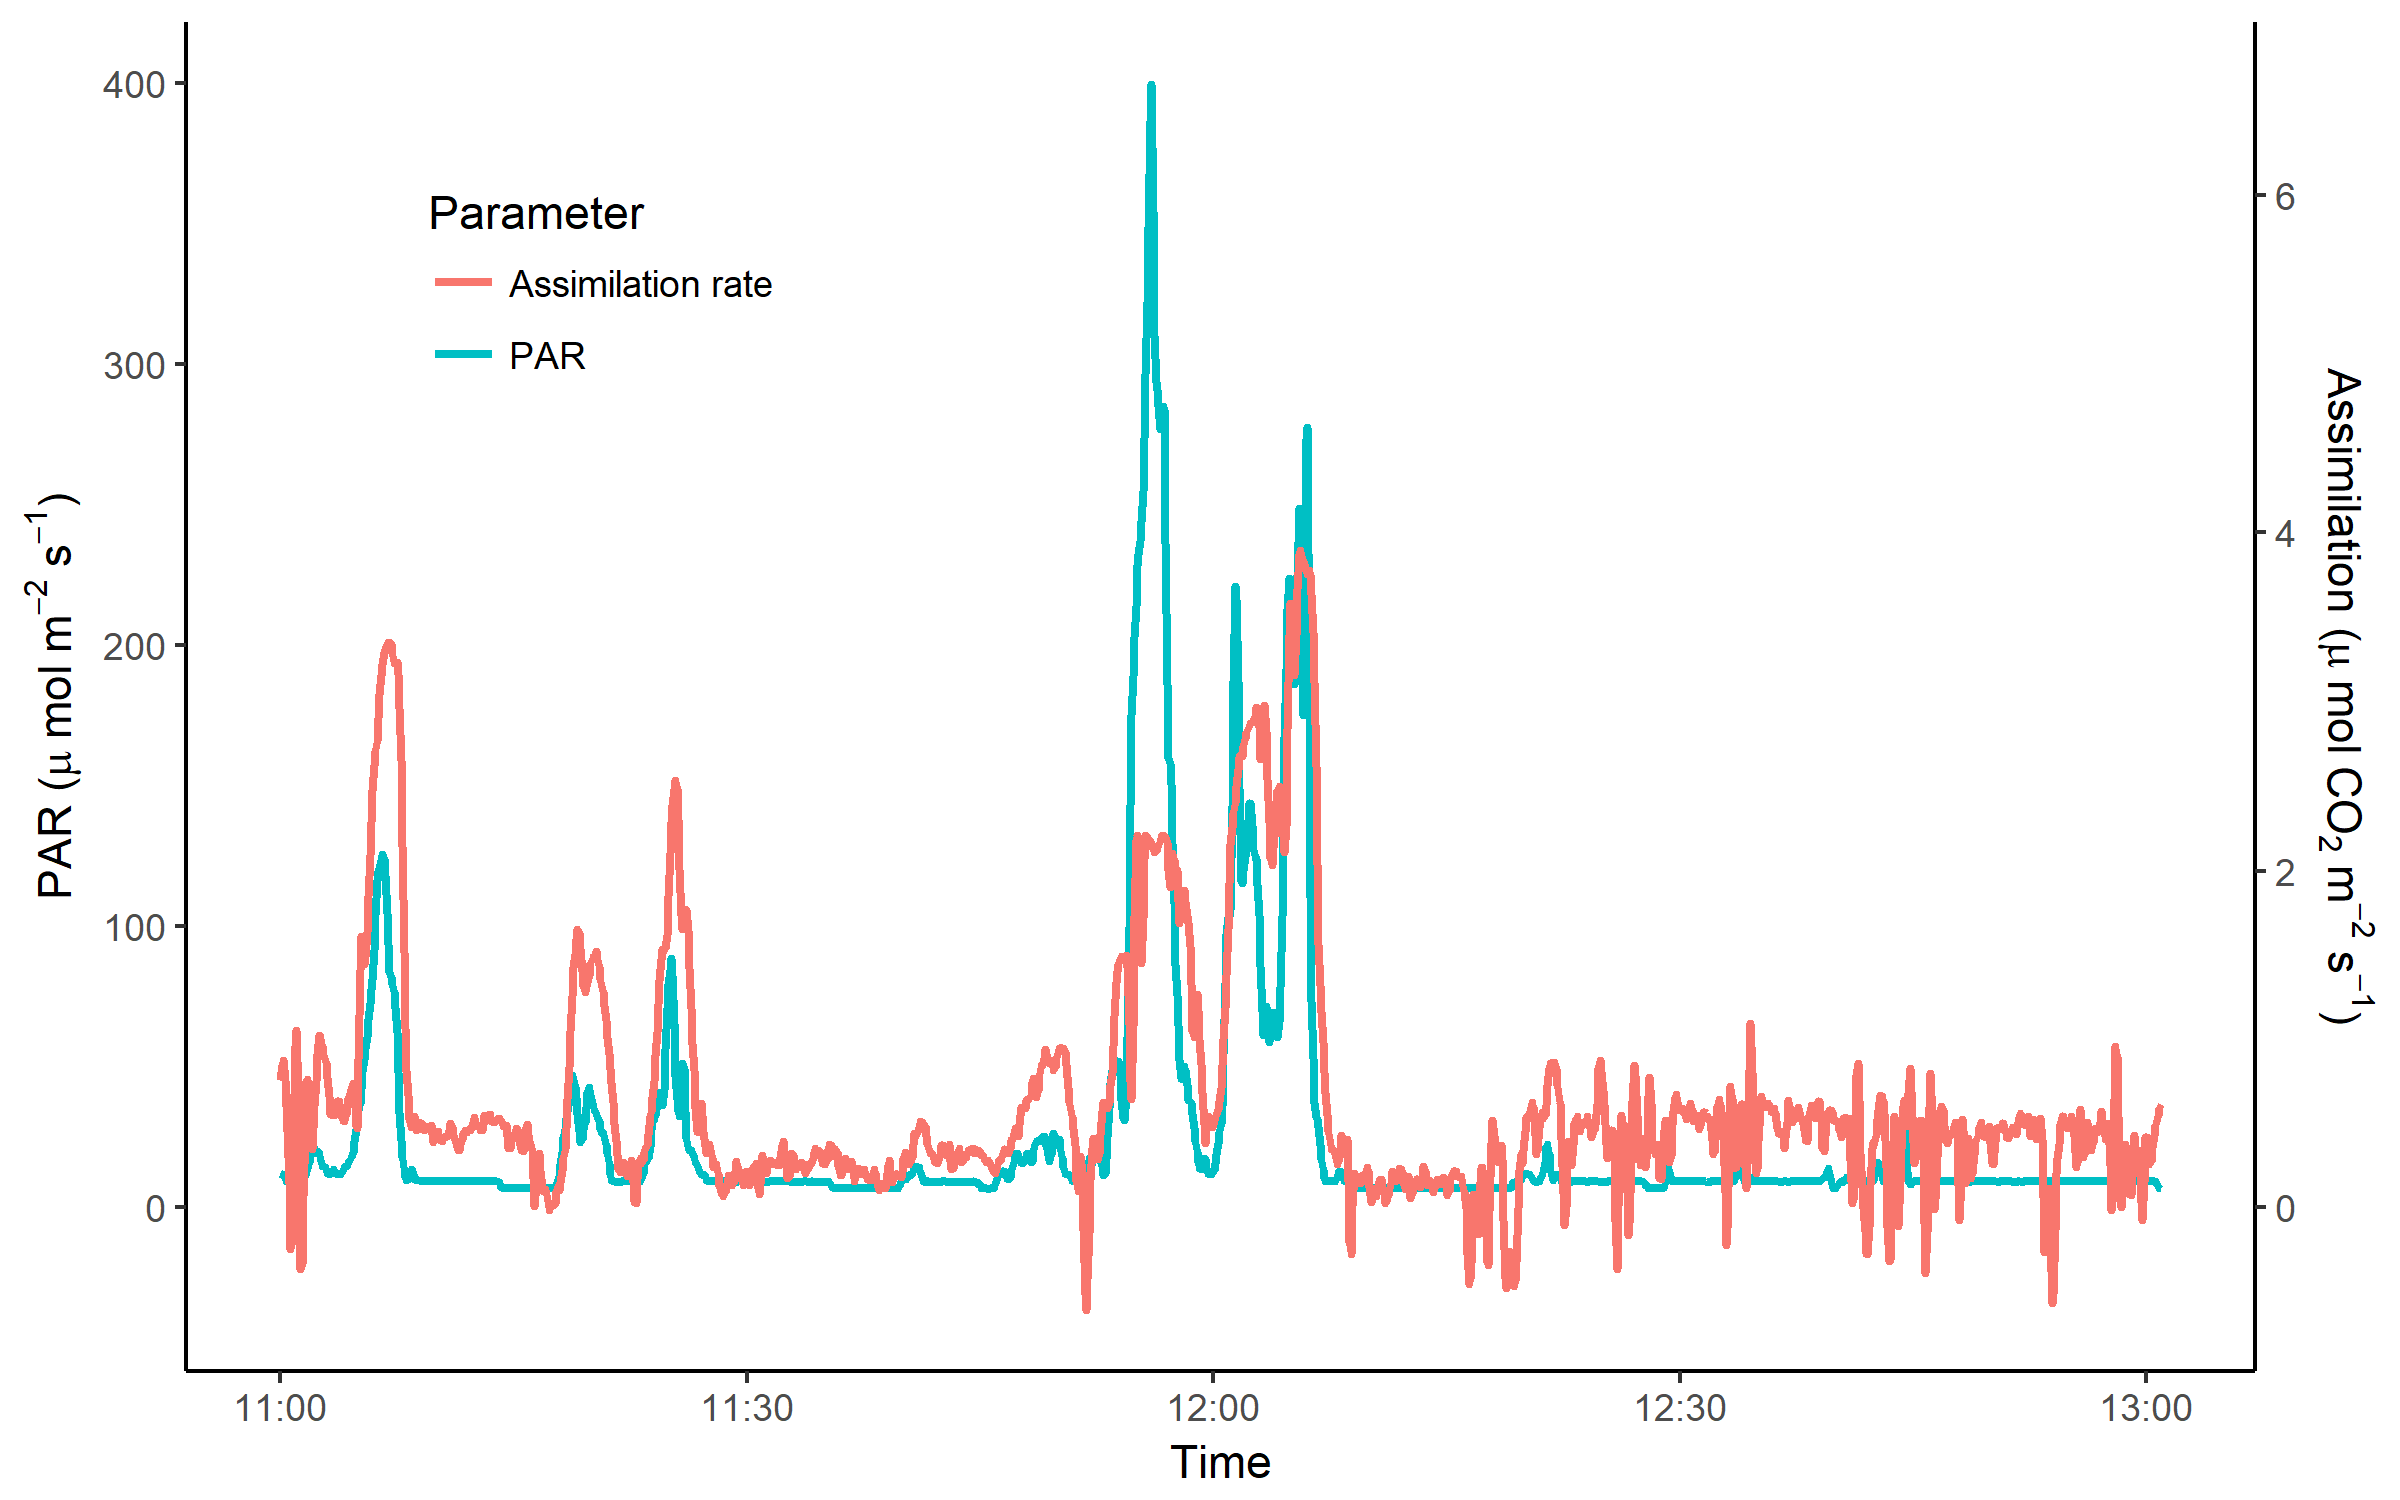
In this tutorial, we will learn to work with pipes %>% and other dplyr functions, as well as different plotting techniques using the ggplot2 package, such as having two y axises and printing axis labels with characters like μ. We will apply our data maninpulation and data visualisation skills to explore the importance of sunflecks for carbon assimilation in an understorey herb based on a LI-COR dataset (leaf-level gas exchange measurements) with a temporal resolution of 5 seconds, gathered on a sunny day in June 2017.
You can download the R script that you can turn into a tutorial from this Github repository. Click on Clone/Download Zip, download the files and unzip them. The script for this tutorial R_script_LICOR.R and the data LICOR.csv are in the sunflecks folder.
Analysis of spatial movement
By Stefano Masier
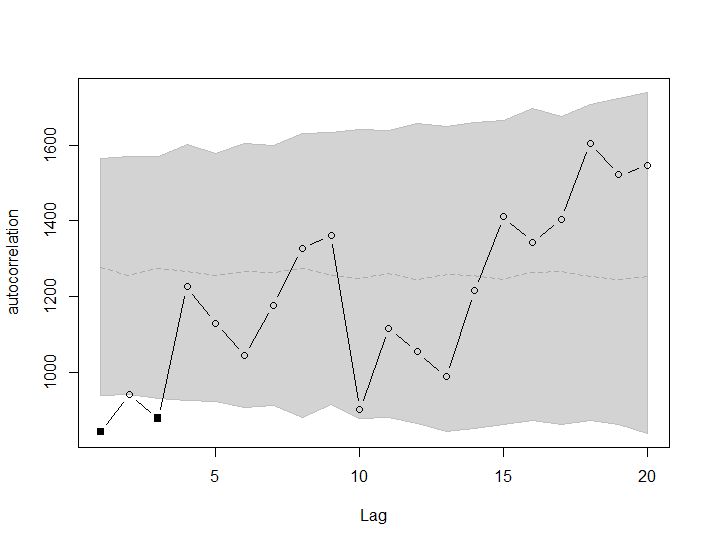
The aim of this tutorial is to visualize data from a series of geographical coordinates coming from monitoring the movement of mites. The goal is to handle a series of coordinates, plot the path itself and determine if there are points along the way that are autocorrelated.
You can download the R script that you can turn into a tutorial from this Github repository. Click on Clone/Download Zip, download the files and unzip them. The script for this tutorial Dispersion_script.R and the data Dispersion.txt are in the spatial_movement folder.
Publish your tutorial on Github
Next we can publish our tutorial on GitHub, which will turn it into a website, whose link you can share with your peers - transferring quantitative skills among ecologists in action!
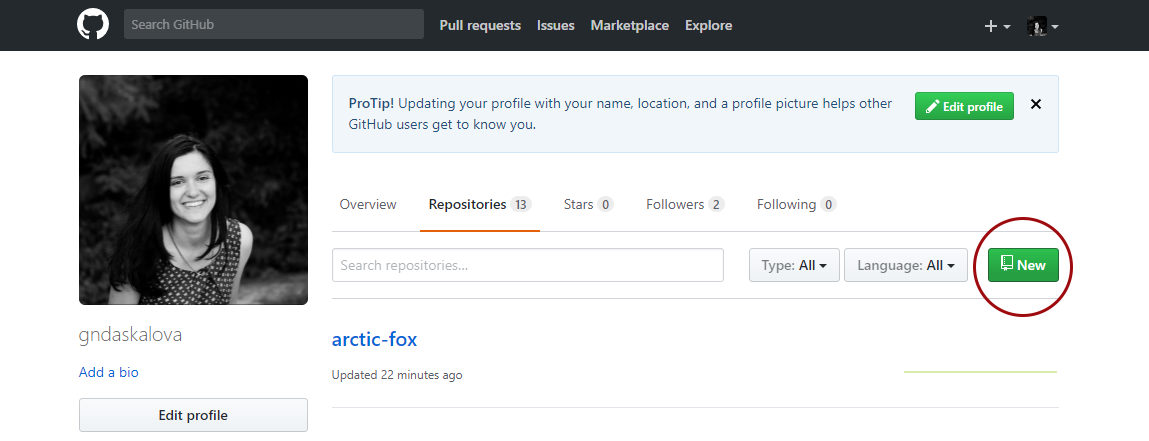
Go to the GitHub website, register if you don’t already have an account (it’s free) and click on New Repository.
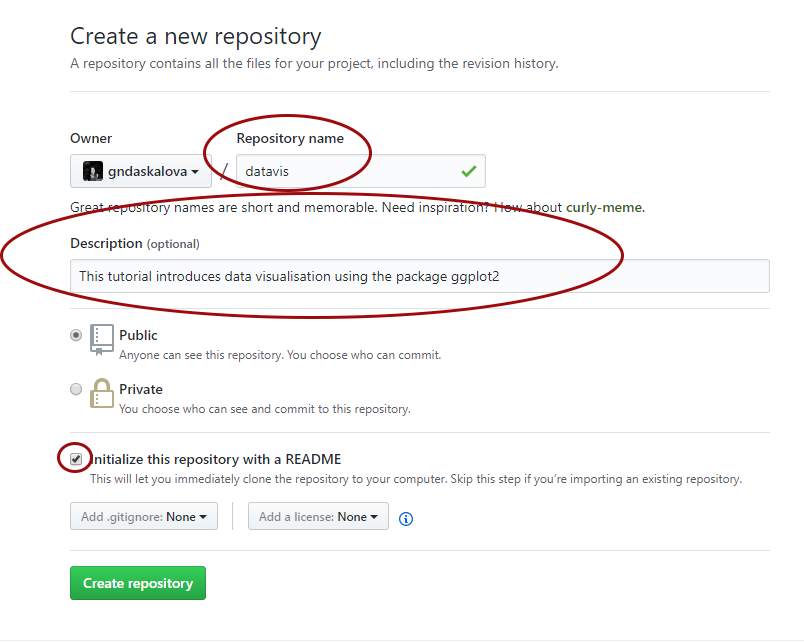
Choose a name for your repository: that will form part of the link for your online tutorial so choose something short and informative. Add a brief description, click on Initialize with a README.md and then click on Create repository.
Now you can see your new repository. Click on Upload files and upload your filled in Markdown template. Make sure you save the file as index.md - that will make your tutorial the landing (home) page of the website. Upload any images you are using in your tutorial as well.
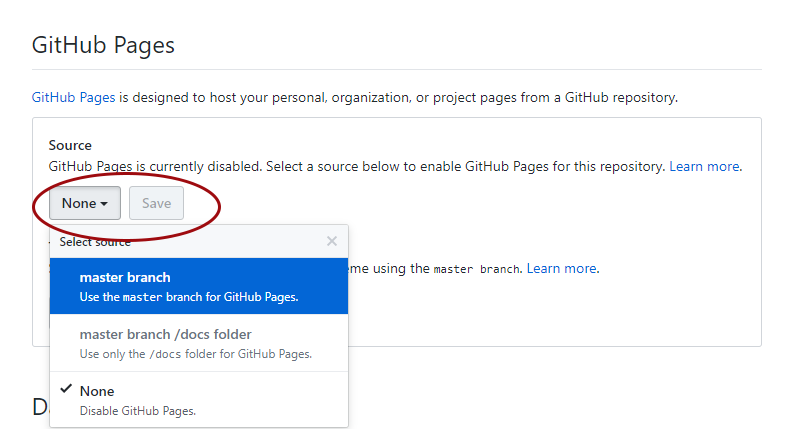
You are two clicks away from having a website with your tutorial! Now click on Settings and scroll down to the GitHub pages section. We need to enable the GitHub pages feature, which turns our index.md file into a page, i.e. website. Change Source from None to master - the master branch of our repository. Click on Save.
Congratulations, your repository is now published as a website!
Scroll down to the GitHub pages section again - you can see the link for your tutorial! If you need to edit your tutorial, you can go back to your repository, select the index.md file, then click on Edit and make any necessary changes. You can also check out different themes for your website, though the default one is clean and tidy, which works well for coding and statistics tutorials in general.
We would love to see your tutorials - feel free to share them with us on Twitter __@our_codingclub or via email ourcodingclub(at)gmail.com
Contribute a tutorial
Are you keen to share some of your coding and statistics knowledge? We would love to have more people join our team and build a world-wide community of people teaching and learning together! You can take a look at the tutorials we have already developed. Feel free to make suggestions for changes on existing tutorials and get in touch with us at ourcodingclub(at)gmail.com if you would like to make a new tutorial.
Useful resources
You can also make a website with multiple pages, rather that having a single page (your index.md file). That’s how we’ve made the Coding Club website and the Aberdeen Study Group website.
The Mozilla Science Lab has a template you can use for your website and a guide on how to use it.